 Ptah
Qualifying Ptah Operator 0.2.4: What Broke and What We Changed
Ptah Operator 0.2.4 is accepted for production under a declared profile. This is what five releases of qualification found and what we changed.

Ptah helps you plan, review, and apply database migrations. Try in your browser
Ptah Operator 0.2.4 is the first operator release we accept for production use. The acceptance covers a declared profile, and the evidence for it is published. Alerting under it needs a ServiceMonitor you apply yourself, because the one in the 0.2.4 chart scrapes nothing (#673).
The operator plans schema changes and migrations, waits for approval, and applies the DDL to live databases, so one wrong dispatch can lose data. Our CI already ran every acceptance suite on three Kubernetes minors. Those runs proved a build from the branch under the suites’ own conditions. They did not show how the image a user downloads behaves under a production workload, through the loss of every manager, or after a restore from backup.
So before testing, we wrote down what production means: the workload, the versions, the API budget and the recovery objectives. The released artifacts then ran against that declaration, and acceptance waited until every requirement had evidence.
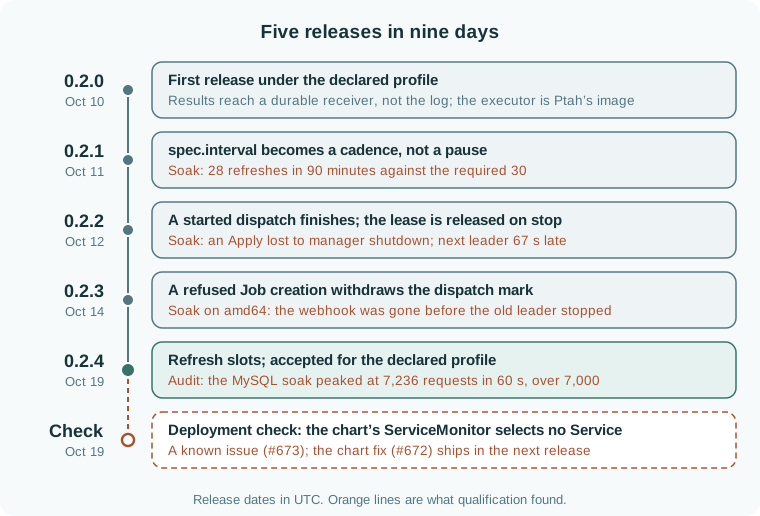
Holding to that declaration took five releases in nine days: 0.2.0 on October 10 and 0.2.4 on October 19. This post covers what we declared, what qualification found in the operator and in our own test harness, what we changed, and where the evidence stops. If you have not used the operator yet, Your First Schema Change with the Ptah Kubernetes Operator shows the workflow these requirements protect.
What we declared before testing
Section titled “What we declared before testing”Issue #242 lists twelve requirements. They range from “execute only authorized database work” and “preserve safety through an interrupted Apply” to restore, capacity, alerting, documentation and artifact verification. A requirement closes on runs against the release candidate, or on earlier runs with a recorded review showing that the changes since then do not reach what those runs proved. A closed issue, a merged fix or a green pull request does not count.
The profile fixes the conditions:
- 20 resources, 10 PtahSchemas and 10 PtahMigrations, in two namespaces, each refreshing every two minutes, with two manager replicas.
- PostgreSQL 17 and MySQL 8.4 LTS, on Kubernetes 1.35 to 1.37, on linux/amd64 and linux/arm64.
- At most 7,000 manager requests to the Kubernetes API in any 60-second window, summed across both replicas.
- A five-minute recovery point. Fifteen minutes to recover from lost operator state, and thirty from a lost database or both, including the manual steps.
The evidence comes from three matrices, and every cell installs a release’s own image digests, not a build from the branch:
| Matrix | Cells |
|---|---|
| Functional | 54: three Kubernetes minors × nine acceptance suites × two architectures, each on its own kind cluster |
| Capacity | 9: three edges of the support window × a 90-minute soak, an approval backlog and an overload |
| Restore | 9: three kinds of loss × three moments at which the loss happens |
We changed two targets during the work. Each change is a numbered revision of the profile, and the verdicts recorded before it stand. One raised the API budget from 6,000 to 7,000 requests per minute. The budget caps the operator’s share of the Kubernetes API server, and 7,000 is a product decision: enough for an early release at this scale, and not the level the operator has to stay at. The limits on API pressure did not move: no 429 responses, no priority-and-fairness rejections, and at most 10 seconds of client throttling in any 10 minutes. The other change is described below.
Before the first release
Section titled “Before the first release”The largest change before 0.2.0 was how operation results travel. The runner used to print its result to standard output, and the controller read it back through the container log. A large plan needed a kubelet log limit of 64 MiB, and a slow log read held a reconcile worker that other resources were waiting for.
We replaced that path with an authenticated receiver inside the installation. It stores each result as an immutable record and acknowledges it only after the record is durable. An acknowledged result survives the loss of its Pod, its logs and the manager that received it.
The first version of the new transport created a credential Secret for every operation and kept it through the retention window. After about 115 Jobs, a namespace reached its quota of 128 Secrets and new operations timed out. Operation Pods now authenticate with bound service-account tokens, which consume no quota.
For six days, while the new transport landed, no run of the acceptance workflow passed. A complete matrix run now takes about an hour and a half.
The operator repository also stopped rebuilding the Ptah executor. Earlier releases built, signed and shipped a copy of their own. The operator now runs the image Ptah publishes, pinned by digest, so each project releases what it builds. Moving to that image brought its newer drift categories, and we re-recorded the inspection SQL our tests check against real PostgreSQL and MySQL servers.
A release you can interrupt
Section titled “A release you can interrupt”A release transaction can stop at any point, for example when CI loses its runner. We interrupted it on purpose three times. The first stop came while images were staged, the second after 5 of 8 assets had uploaded, and the third during final verification. Each retry finished without replacing a byte the interrupted run had already written.
A retry started from the tag failed, and it failed safely. Go stamps
version-control information into a binary, so clients built from the tag
differed from the attested clients built before tagging. The transaction
refused to replace them. Builds now pass -buildvcs=false, and a build from
the tag matches a build from the commit.
After every publication, we download each asset anonymously and compare it with the qualified draft. All eight assets of 0.2.4 matched byte for byte.
What the soak found in the operator
Section titled “What the soak found in the operator”The capacity soak runs the profile for 90 minutes: nine rounds of changes, churn, a retention fault, a registry outage, a slow database and a restart of every manager.
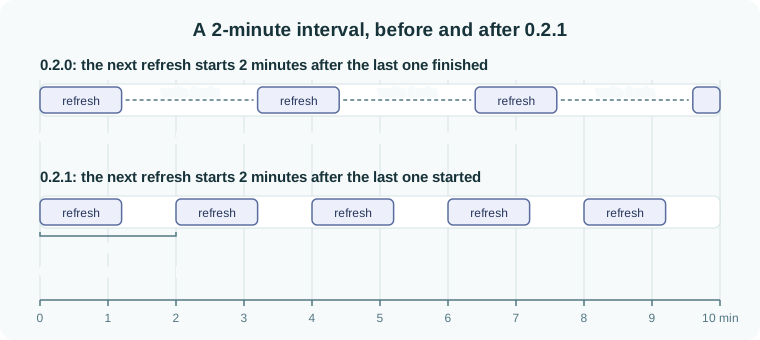
0.2.1: interval was a pause, not a cadence. The API documents
spec.interval as how often a resource refreshes. The controllers scheduled
the next refresh one interval after the previous one finished. A two-minute
interval with a refresh of about a minute came out to one refresh every 3.2
minutes, or 28 refreshes in 90 minutes against the required 30. An interval
now runs from the start of one refresh to the start of the next.
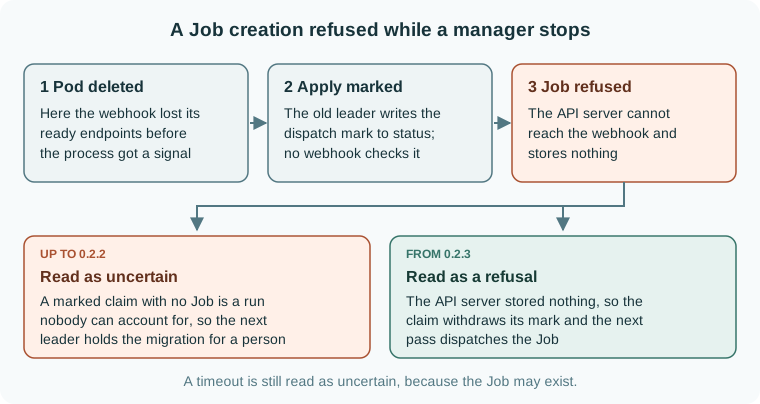
0.2.2: a dispatch lost to shutdown. An approval arrived while the managers were being replaced. The stopping leader claimed the Apply, marked it as dispatched, and then lost the Job creation to its own shutdown. A marked claim with no Job is a run nobody can account for, so the next leader held the migration for a person. That hold is the designed safe state. The defect was reaching it at all.
The next leader also started 67 seconds late. The manager’s 30-second graceful stop raced the kubelet’s 30-second kill, so the old leader never released its lease. A dispatch no longer starts on a canceled context. A started dispatch finishes on a context that shutdown cannot cancel, the graceful stop ends in 20 seconds, and the lease is released on stop.
0.2.3: a refusal treated as uncertainty. The same scenario failed again on amd64 with that fix in place. Kubernetes updates a Service’s endpoints and stops a deleted Pod in parallel. In this run, the admission webhook lost its ready endpoints before the old leader received its stop signal, so the leader was still running. It marked the Apply, which is a status write that no webhook checks, and then its Job creation was refused because the webhook was unreachable. The operator treated every creation error as uncertain. An error the API server returns before storing anything is now read as a refusal: the claim withdraws its mark, and the next pass dispatches. Timeouts stay uncertain, because the object may exist.
What it found in our own harness
Section titled “What it found in our own harness”Many failures were in the measurement, not the operator. The overload inputs were pushed unsigned to a registry the lab does not trust, so all 942 of their resolve Jobs failed. The kernel killed the MySQL fixture at its memory limit late in the soak. The PostgreSQL fixture reported ready while its temporary initialization server was still running. A database delay proxy delayed nothing, because the lab denied its egress and its own Service selected it.
Each of these was fixed where it started. A rerun that passed was not enough to close a failure: each one stayed open until its cause was known. Keeping product defects apart from harness defects is most of the work.
One rule came from that. Our recovery harness used to take its own commit as the release under test, so every fix to the harness required a new release. It now reads the release identity from the signed manifest. A harness commit is accepted if it descends from the release and changes nothing the release ships.
A target that contradicted its own workload
Section titled “A target that contradicted its own workload”The soak required 30 read-only refresh cycles for every resource in 90 minutes. The resources the soak changes in every round spend two or three intervals per change on planning, approval, Apply and the observation that proves the result. Those resources could reach at most 18 to 27 read-only cycles, whatever the operator did.
The requirement was wrong, not the operator. Unchanged resources still need 30 cycles. Changed resources must converge on all nine changes, with one read-only cycle after each. Earlier soak reports were judged again under the new rule. Two runs that had stopped early still fail, as they should.
Counting requests instead of estimating them
Section titled “Counting requests instead of estimating them”Our driver estimated API demand from the managers’ request counters, sampled every five seconds. Those samples bound a 60-second peak from above. On the 0.2.3 PostgreSQL soaks, the bounds were 7,341 and 7,458 requests: over the budget as bounds, which proves neither a pass nor a failure.
For an exact count, each lab now records a Kubernetes audit event for every request from the manager identity, on all three API servers. Recording starts before the workload exists and stops after measurement. The peak is computed from arrival times. A completeness check holds each manager process’s own counter to the audited requests between two counter reads. In one run, a process that had sent over 300,000 requests reported a count inside an audited range only eight requests wide.
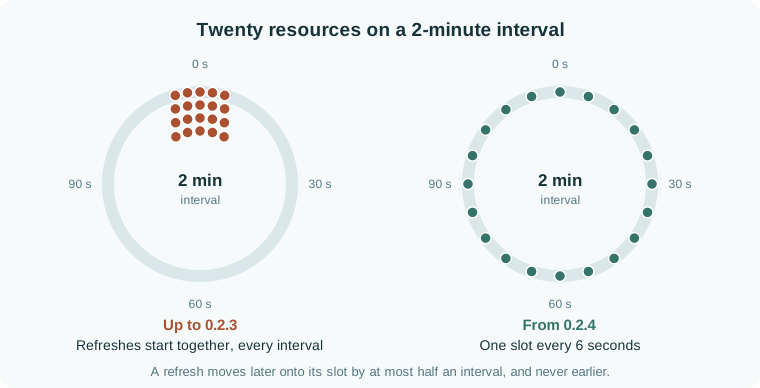
With exact counts, the PostgreSQL soaks passed at 6,714 and 6,732. The MySQL soak failed at 7,236, in its last round of changes. Resources created together had refreshed together, and their refreshes kept landing in the same minute.
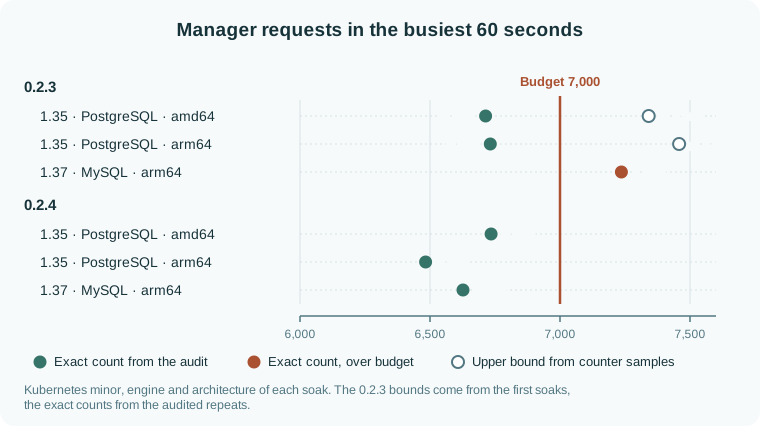
0.2.4 spaces refreshes across the interval. Resources that share an interval get evenly spaced slots. A refresh can move later by up to half an interval and never moves earlier. The same MySQL soak peaked at 6,627.
So spec.interval is a base period. A slot can delay one refresh by up to half
an interval, a minute at the profile’s two minutes. The profile bounds what
that may cost: outside a deliberate fault, no database observation may be more
than five minutes old. The 0.2.4 soaks stayed under that bound.
Restore
Section titled “Restore”Each restore cell loses the operator’s state, the database, or both, while idle, during an Apply, or while the latest backup lags. It restores from real backups into a separate cluster and then checks what a restore must not do. The approval given before the loss is refused instead of replayed, nothing is applied until someone approves again, and exactly one fresh Apply follows, whose change reaches the restored database. Recovery took 130 to 591 seconds against bounds of 900 and 1,800, and every database recovery point was under 60 seconds old.
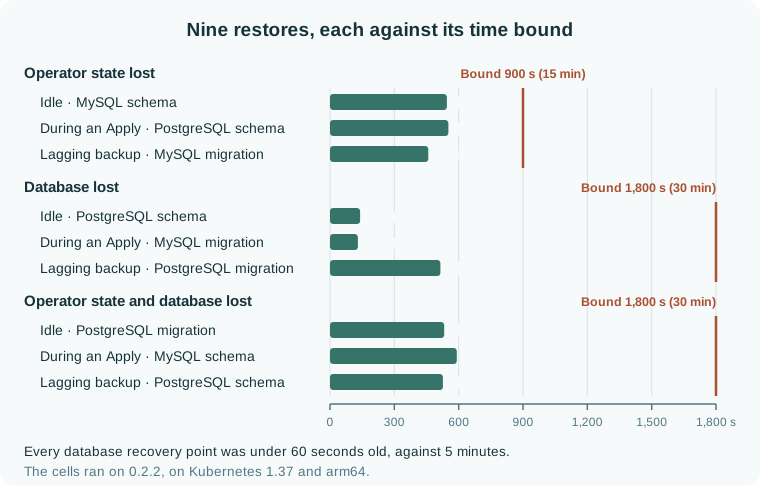
The cells ran on 0.2.2. A recorded review of every runtime change since then carries them to 0.2.4. Those changes are the result-cleanup budget and the refresh slots, and neither touches a restore procedure or a stored format.
The final check found one more defect
Section titled “The final check found one more defect”After the acceptance decision, we ran one more deployment check. It installs 0.2.4 by digest on a fresh cluster with the profile’s monitoring values and a Prometheus Operator stack. Then it removes every manager, requires the lost-view alert to reach a webhook receiver, restores the managers, and requires the resolution to arrive.
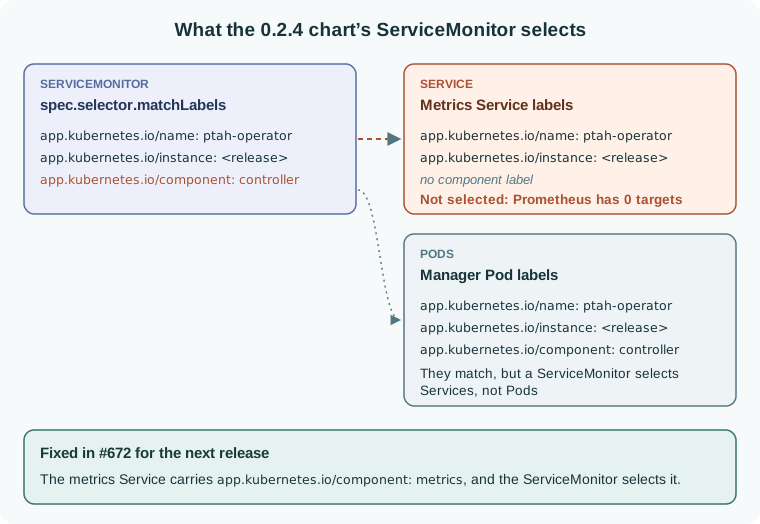
It found that the chart’s ServiceMonitor selects no Service. It selects by a label the manager Pods carry and the metrics Service does not. Prometheus had no target, and every alert rule read a missing series. Our alerting tests had not caught it, because they scrape the managers without the chart’s ServiceMonitor, and the chart’s own test asserted the Pod label.
With a ServiceMonitor that selects the metrics Service, the alert reached the receiver 84 seconds after the managers were removed. The resolution arrived 23 seconds after they returned.
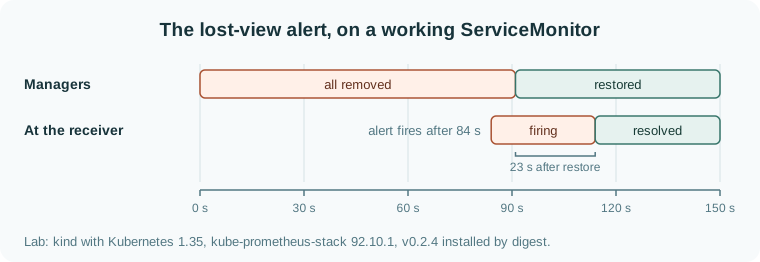
The first version of that check passed for the wrong reason, and we kept the run. It accepted a firing notification from the earlier minutes when nothing was scraped. A notification now counts only if its incident started after the managers were removed. The chart fix is merged and ships in the next release. From that release on, this deployment check is required evidence in every qualification (#675).
What 0.2.4 is accepted for
Section titled “What 0.2.4 is accepted for”All nine capacity cells passed with exact audited counts. Peaks are manager requests in the busiest 60 seconds, against 7,000. Overload doubles the fleet to 40 resources. That is outside the profile, so it is judged by recovery after the load returns to 20, against a five-minute bound.
| Edge of the support window | Soak peak | Backlog peak | Overload recovery |
|---|---|---|---|
| Kubernetes 1.35, PostgreSQL, amd64 | 6,735 | 5,890 | 2m32s |
| Kubernetes 1.35, PostgreSQL, arm64 | 6,483 | 6,161 | 2m25s |
| Kubernetes 1.37, MySQL, arm64 | 6,627 | 5,839 | 1m47s |
The functional matrix passed all 54 cells on the release’s digests. The
published installation guide worked on fresh clusters on both architectures,
both as a new install and as an upgrade from 0.2.3. All four signed
kubectl-ptah builds read a real plan, schema and migration.
The acceptance covers the exact 0.2.4 artifacts, installed with the recorded values, under the declared profile. The record keeps its limits beside the decision:
- The request budget is not claimed while a Kubernetes API server restarts or the controller manager fails over. In those minutes, the managers re-read every resource at once (#657).
- The pinned executor was built with a Go release that has later advisories. None is reachable the way the operator runs it (#610).
- Alerting needs a ServiceMonitor you apply yourself, as described under Known issues.
The acceptance record lists each requirement with its evidence. The public bundle holds the coverage audits, the capacity assessments, the recovery chain and the release read-back.
Known issues
Section titled “Known issues”- In 0.2.4, the chart’s ServiceMonitor selects no Service, so
monitoring.serviceMonitor.enabledalone scrapes nothing. #673 has the ServiceMonitor to apply instead.